Quantifying Port Strikes Impact in Antwerp and Rotterdam
Nov 18, 2025
At Sea Sentinel AI, we help our customers predict and manage disruptions to their ocean container operations. By analyzing more than 500.000 news articles a day, alongside a sea of weather, AIS, and governmental data, we keep our customers ahead of the curve.
When major disruptions hit the supply chain, the impact is felt by everyone. But often, the full extent of that impact—the "how bad was it, really?"—goes unquantified. We believe in moving from 'feeling' to 'fact'.
Take the October strikes at Europe’s two most important container ports. As port workers, traffic controllers, and lashers went on strike in Antwerp and Rotterdam, shippers and forwarders were in crisis.
We didn't just report on the negotiations in real-time. We decided to measure the actual impact on port operations.
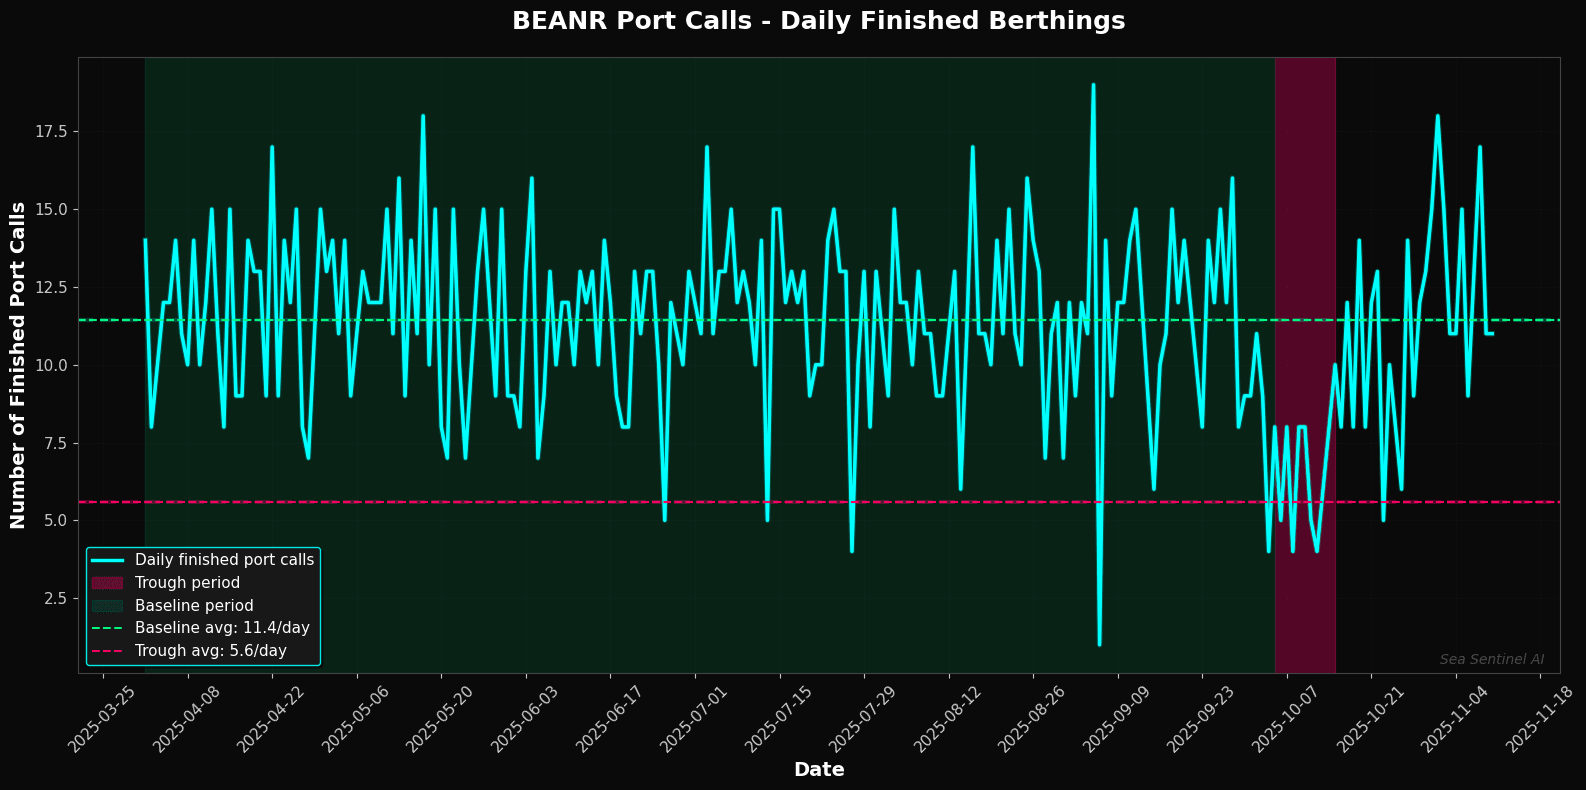
The results are striking. We compared the "trough period" (the strike) to the baseline average from the previous six months.
📊 Port of Antwerp (BEANR): A 51.1% Reduction
Baseline Average: 11.4 finished port calls/day
Strike Average: Just 5.6 finished port calls/day
📊 Port of Rotterdam (NLRTM): A 50.0% Reduction
Baseline Average: 15.6 finished port calls/day
Strike Average: Just 7.8 finished port calls/day

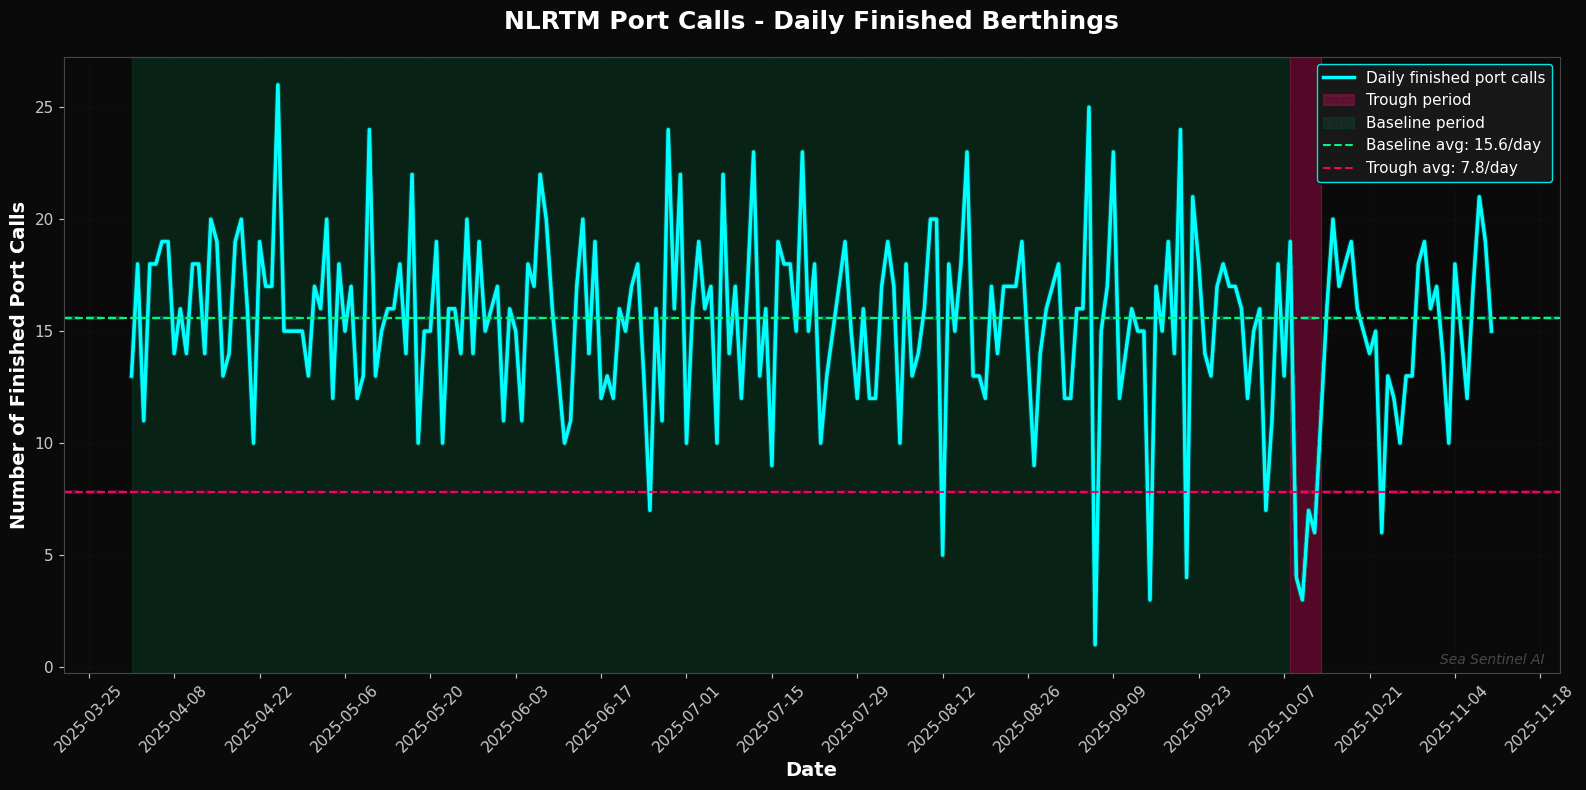
The graphs show this dramatic drop. But there is another story in the nuances of the data:
Insight 1: The "Catch-Up" That Never Came Look at the data after the maroon "Trough period." There's no significant spike. This implies ports couldn't (or didn't) play catch-up. This suggests that a massive number of vessels likely omitted the port calls entirely.
Insight 2: An Eerily Similar Impact Strikes are rarely homogeneous. However, in this case, the relative effect on two different ports, with different striking groups, was almost identical at a 50% reduction.
Insight 3: The Early Warning Sign For BEANR, the trough period began 1-2 days before the strike officially started. This shows the "chill effect" as the supply chain braced for impact—a crucial leading indicator.
Insight 4: Steady Efficiency Interestingly, our port productivity metrics (not shown here – they measure efficiency, not just volume) remained constant for the few vessels that did berth. Work that got done, got done normally.
This is the difference between reporting on an event and quantifying its true impact. Data-driven analysis is essential for understanding the real dynamics of the supply chain.